
Company Sponsored Project

Optimizing Wayfair Ads Dashboard

Making campaign performance understandable and actionable

UX Research, UXUI Design, Product Ideation, Product Strategy

Wayfair’s advertising platform enables furniture suppliers to promote products across the marketplace. However, many suppliers struggled to understand campaign performance and determine what actions would improve results, forcing suppliers to rely heavily on account managers for analysis and recommendations.


In partnership with Wayfair, our team designed features that help suppliers move from fragmented campaign data to actionable insights. We introduce goal-driven campaigns, automated performance diagnostics, and actionable insights that help suppliers optimize campaigns independently.

Wayfair’s advertising platform enables furniture suppliers to promote products across the marketplace. However, many suppliers struggled to understand campaign performance and determine what actions would improve results, forcing suppliers to rely heavily on account managers for analysis and recommendations.


In partnership with Wayfair, our team designed features that help suppliers move from fragmented campaign data to actionable insights. We introduce goal-driven campaigns, automated performance diagnostics, and actionable insights that help suppliers optimize campaigns independently.

Timeline

4 months

Tools

Figma

Adobe Photoshop

Claude Design

Project Type

B2B

Ads platform

Seller Tool

Team

Jiyeon, UXD

Hasneet, Project Manager

Yash, Project Manager

Victoria, CS

Yoyo, CS

Team

Jiyeon, UXD

Hasneet, Project Manager

Yash, Project Manager

Victoria, CS

Yoyo, CS

Project Type

B2B

Ads platform

Seller Tool

Team

Jiyeon, UXD

Hasneet, Project Manager

Yash, Project Manager

Victoria, CS

Yoyo, CS

Wayfair’s advertising platform enables furniture suppliers to promote products across the marketplace. However, many suppliers struggled to understand campaign performance and determine what actions would improve results, forcing suppliers to rely heavily on account managers for analysis and recommendations.


In partnership with Wayfair, our team designed features that help suppliers move from fragmented campaign data to actionable insights. We introduce goal-driven campaigns, automated performance diagnostics, and actionable insights that help suppliers optimize campaigns independently.

Timeline

4 months

Tools

Figma

Adobe Photoshop

Claude Design

Project Type

B2B

Ads platform

Seller Tool

Team

Jiyeon, UXD

Hasneet, Project Manager

Yash, Project Manager

Victoria, CS

Yoyo, CS

Team

Jiyeon, UXD

Hasneet, Project Manager

Yash, Project Manager

Victoria, CS

Yoyo, CS

Project Type

B2B

Ads platform

Seller Tool

Team

Jiyeon, UXD

Hasneet, Project Manager

Yash, Project Manager

Victoria, CS

Yoyo, CS

Case Study at a Glance

My Role

I led UX design for campaign analytics and optimization, including problem framing, competitive research, interaction design, and final prototyping. I collaborated with project managers on research and product strategy.

From fragmented campaign data to guided optimization

Wayfair sellers could see campaign metrics, but they lacked the context to understand what a campaign was trying to achieve, why it was underperforming, and what action to take next. This also created operational drag because account managers were manually diagnosing campaigns and generating recommendations.

Wayfair sellers could see campaign metrics, but they lacked the context to understand what a campaign was trying to achieve, why it was underperforming, and what action to take next. This also created operational drag because account managers were manually diagnosing campaigns and generating recommendations.

Before
I helped redesign the advertising experience around three principles:
01 Define Intent

Introduce goal-based campaign creation so sellers can explicitly state whether they are launching a product, promoting bestsellers, clearing inventory, or running a standard campaign.

02 Diagnose performance

Translate raw metrics into campaign health, root-cause insights, and explanations of what the ad system can actually influence.

03 Guide the next action

Prioritize the highest-impact opportunities and turn diagnosis into specific recommendations around controllable levers such as bid value and budget cap.

The Result

The concept shifts the experience from a dashboard that reports performance to one that helps sellers:

01
Define intent
02
Detect issues
03
Understand why
04
Prioritize opportunities
05
Take action
Final Prototype
https://jiyeonjungart.github.io/wayfair-ads-dashboard/

The Challenge

The platform showed metrics, but not meaning

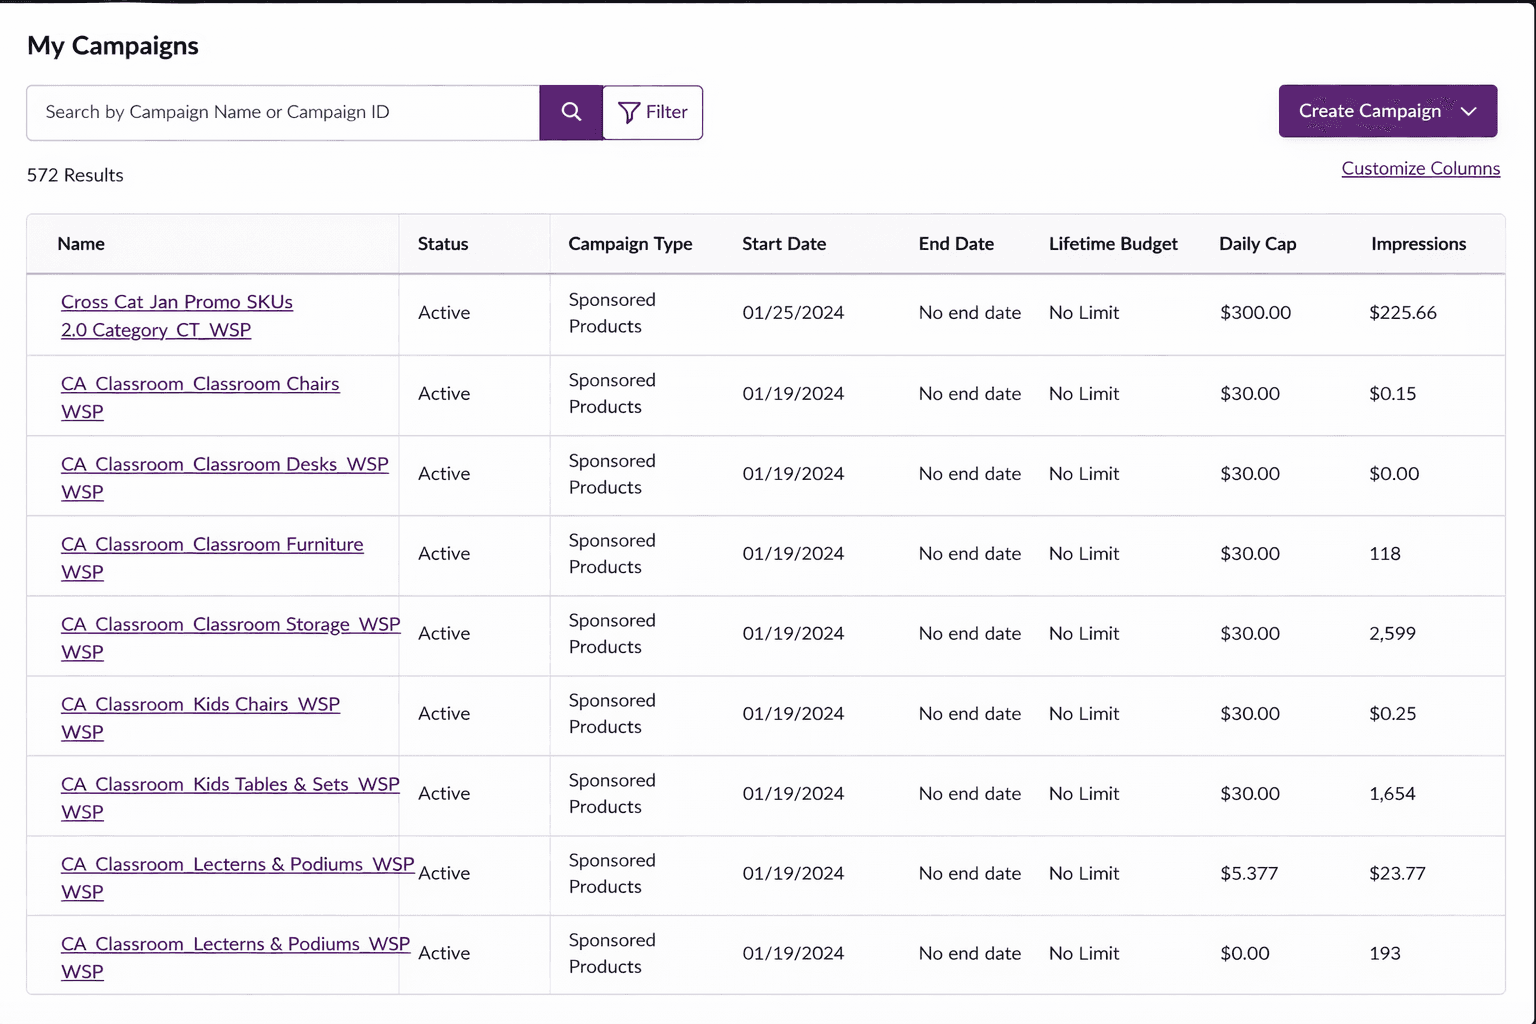
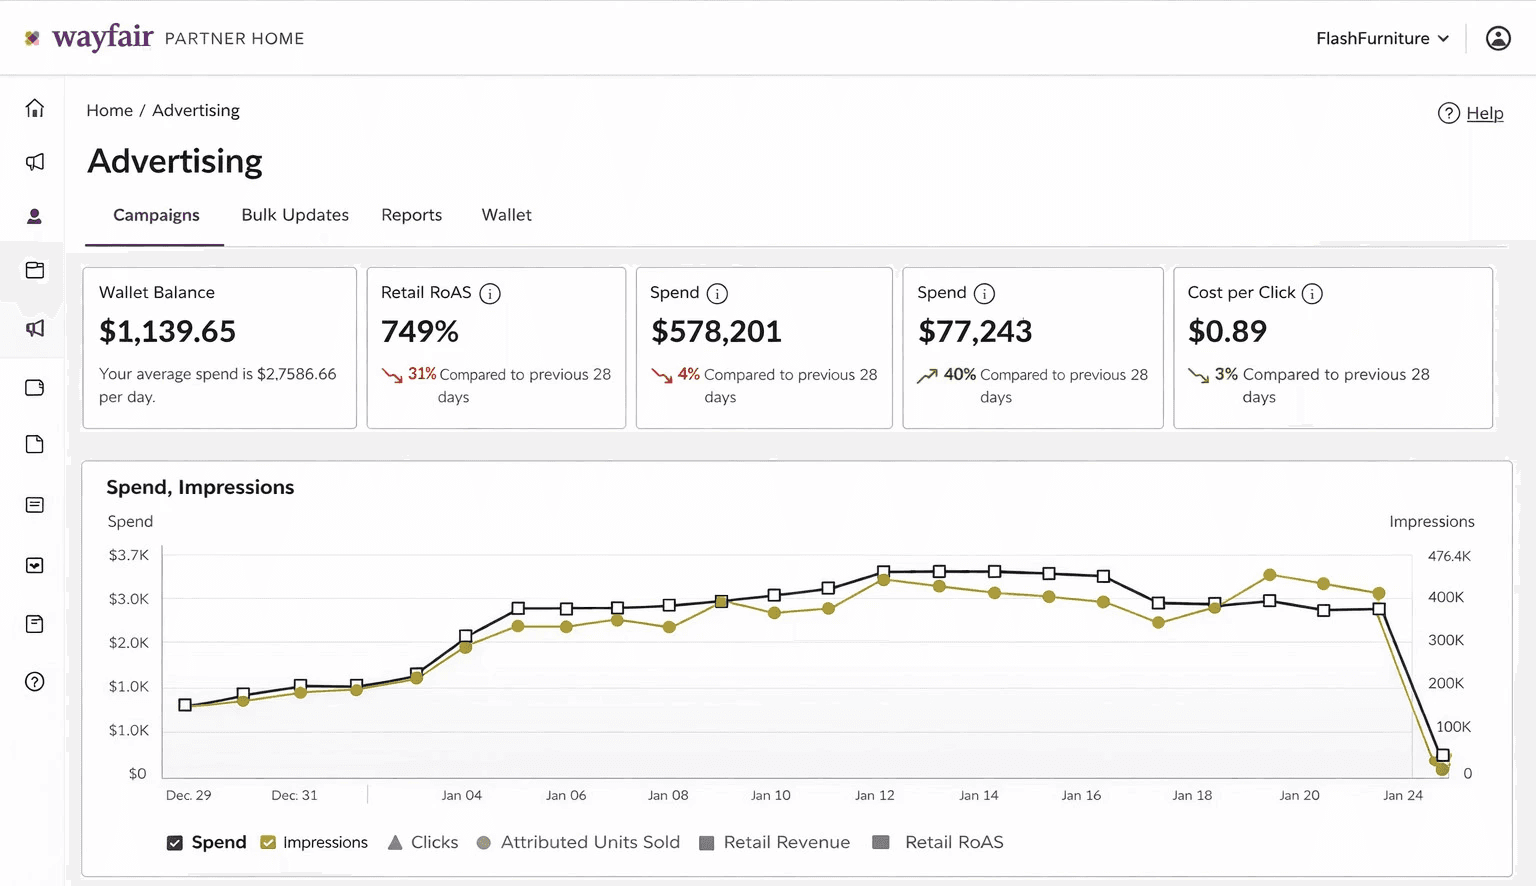
The existing dashboard surfaced campaign details and performance metrics, but it did not give sellers a clear way to understand campaign goals or assess campaign health.
Sellers could see numbers, but they couldn’t easily answer key questions:
What is this campaign trying to achieve?
Is the campaign actually performing well?
What should I change to improve results?
Current State of the Platform

1

2

1

Data without context

Campaign details and metrics are aggregated without any assess the overall campaign performance 

1

Campaign details and metrics are aggregated without any diagnostic tools to assess the overall campaign performance 

Data without context

2

No information on why the campaign might be underperforming

Lack of diagnosis

2

Lack of diagnosis

No information on why the campaign might be underperforming

3

4

4

3

Data without context

No explicit campaign objective

4

No prioritization

Campaigns appeared in a flat table, making it hard to know where to focus

3

Data without context

No explicit campaign objective

3

No explicit campaign objective

Data without context

4

Campaigns appeared in a flat table, making it hard to know where to focus

No prioritization

4

No prioritization

Campaigns appeared in a flat table, making it hard to know where to focus

This also created a second-order operational problem:

Manual Analysis and Recommendation

Account managers were manually reviewing campaign data and generating a small set of recommendations for top campaigns.

Account managers were manually reviewing campaign data and generating a small set of recommendations for top campaigns.

Dependence on Account Managers

Sellers rely heavily on account managers to diagnose campaign issues and determine the appropriate corrective actions.

Sellers rely heavily on account managers to diagnose campaign issues and determine the appropriate corrective actions.

Why does it matter?
Low Clarity Created Costs on Both Sides
Suppliers

Confusion and Low Confident

Suppliers were willing to invest when they could see returns, but many were unsure how to act on them.

Suppliers were willing to invest when they could see returns, but many were skeptical of performance metrics and unsure how to act on them.

Wayfair
Operational Drag and Missed Growth

This limited scalable growth and created avoidable operational burden, and led to lost revenue.

Research

Research approach
We started by looking both outward and inward.
Outward

First, we reviewed campaign creation and management patterns across major platforms, including Google, Meta, Amazon, Walmart, Instagram, and Carousell. The goal was to understand common ad workflow structures and identify UX patterns that reduced friction for advertisers.

Shared User Journey for Ad Campaign Creation and Management Across Platforms

Shared User Journey for Ad Campaign Creation and Management Across Platforms

Campaign Nomenclature

1

Campaign Nomenclature

1

Targeting & Placement

2

Targeting & Placement

2

Bid and Budget Allocation

3

Bid and Budget Allocation

3

Campaign Launch

4

Campaign Launch

4

Metrics Optimization

5

Metrics Optimization

5

What Competitors Taught Us

What Competitors Taught Us

In our review of ad platforms, Google Ads distinguished itself with a range of UX features that effectively support sellers throughout the campaign workflow.
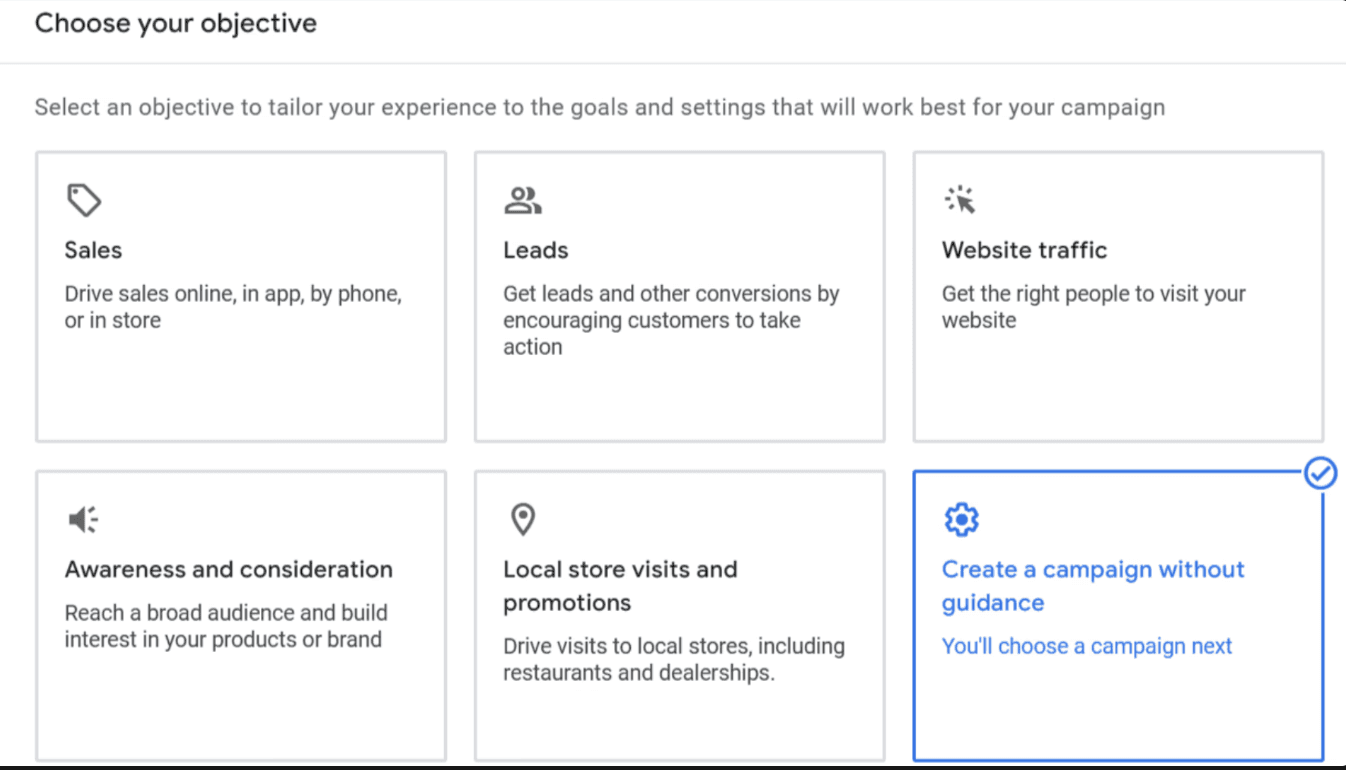
01
Goal Optimization During Campaign Launch
While launching and setting up the the new campaign, users can optimize for the goals they want to achieve
02
Campaign Preview for Advertiser Assurance
03
Best-Practice Guidance Throughout Campaign Creation
Inward

Second, we built an understanding of how Wayfair suppliers manage campaigns and prioritize advertising goals.

High-Touch Vendor Growth Model

Wayfair’s growth model relies on SAMs (Strategic Account Managers) and SMEs (Subject Matter Experts) to directly support vendors, drive sustainable ad growth, and build long-term relationships through multifaceted account management.

Multi-Product Campaign Complexity

Ad campaigns often include multiple products with different goals, adding complexity to performance tracking.

Product-Related Goals

Suppliers primarily use advertising to drive product outcomes rather than brand awareness

  • Launching new products
  • Promoting bestsellers
  • Clearing excess inventory,

Additionally, we gathered core insights from account managers on how they evaluated campaign performance, supported sellers, and decided which optimization actions to recommend.


These conversations helped us understand where and how the product could provide more guidance.

Know What You Can Influence

Not every performance issue can be solved through advertising. Some are driven by campaign settings, while others come from product or conversion factors.

High RoAS (Return on Ad Spend) Can Hide Growth

A very high ROAS did not always indicate optimal performance. In some cases, it suggested that sellers were bidding too conservatively and limiting potential sales volume.

Guidance Should Match Maturity

Newer sellers need clearer guidance, while advanced sellers need deeper analytics and faster control.

Campaign Nomenclature

1

Targeting & Placement

2

Bid and Budget Allocation

3

Campaign Launch

4

Metrics Optimization

5

Ideation & Design

Problem Framing

Based on the findings, we reframed the challenge into three linked UX problems.

3 Key Problem Statments

01
Lack of Categorization Based on Seller Goals

Sellers couldn't define clear goals when launching a campaign, making it difficult to measure success.

02
Difficulty Understanding Campaign Performance

Campaign metrics were presented in an overwhelming and aggregated way, with no clear structure.

03
Lack of Clarity on Campaign Optimization

Sellers didn’t know what to fix or where to focus their efforts.

Framing the Design Opportunity

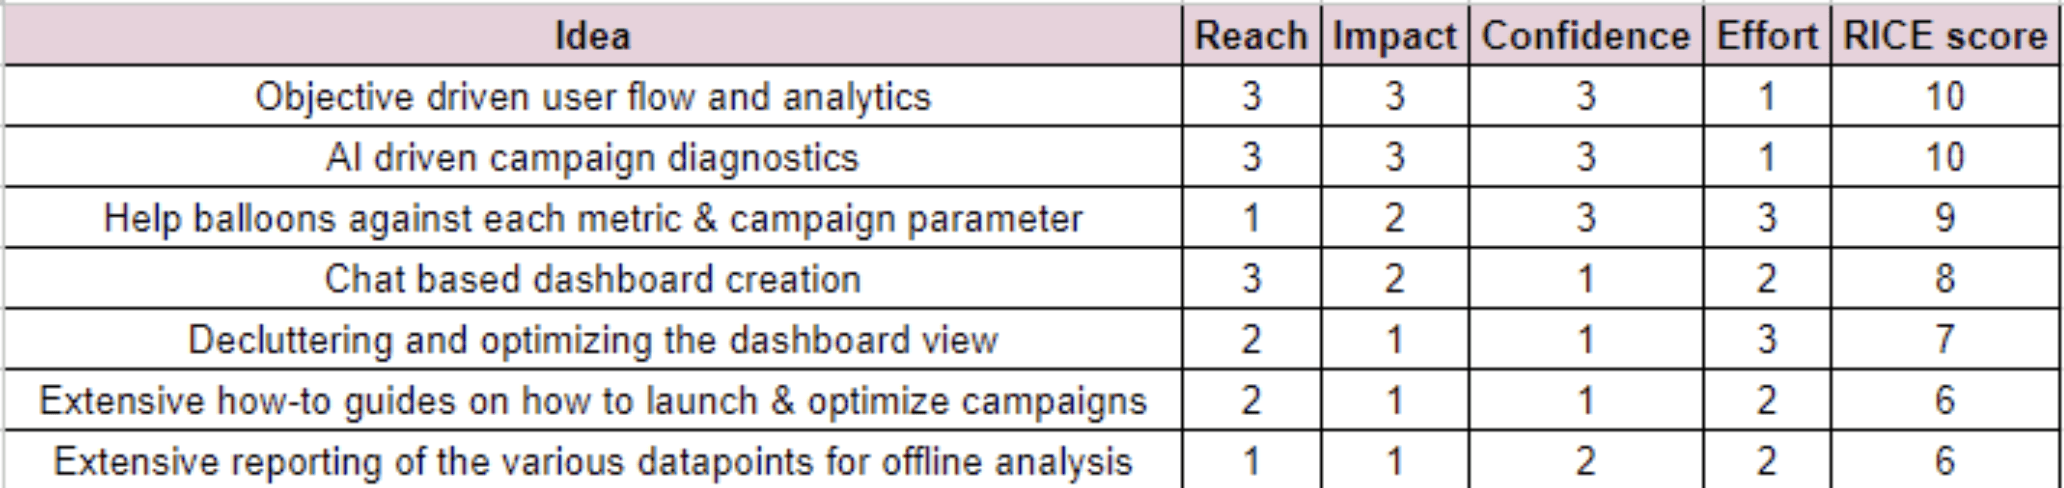
Based on the problems we identified, We evaluated seven ideas against reach, impact, confidence, and implementation effort. Goal-based workflows and automated diagnosis emerged as the strongest opportunities.
Problem + Solution + Impact

The UX opportunity framing gave us three product strategies and thier potential impact:

01 Goal Alignment for Campaigns
Problem
Lack of categorization based on seller goals
Problem
Lack of categorization based on seller goals
Solution
User-driven and product-driven goal definition
Solution
User-driven and product-driven goal definition
Impact
Better optimization of campaign
Impact
Better optimization of campaign
02 Campaign Performance Visibility
Problem
Complexity around understanding campaigns performance
Problem
Complexity around understanding campaigns performance
Solution
Breakdown of data based on objective and performance
Solution
Breakdown of data based on objective and performance
Impact
Improved and quicker understanding of campaign health
Impact
Improved and quicker understanding of campaign health
03 Automated Campaign Optimization
Problem
Lack of clarity on campaign optimization
Problem
Lack of clarity on campaign optimization
Solution
Automated diagnosis with clear root cause identification
Solution
Automated diagnosis with clear root cause identification
Impact
Next steps made easy; high return on effort
Impact
Next steps made easy; high return on effort
How would the prioritization and optimization work?
Defining the Boundary of the Ad System
Separating ad performance problems from product problems

Delivery issues pointed to bid or budget changes, while lower-funnel issues pointed to product quality. Separating these made the recommendations more accurate.

Delivery issues pointed to bid or budget changes, while lower-funnel issues pointed to product quality. Separating these made the recommendations more accurate.

Building a Root-Cause Diagnosis Framework
Designing for diagnosis, not just detection

We designed a root-cause framework that mapped campaign performance into clear diagnostic paths. Campaigns were first grouped by performance, then broken down into likely issues, each tied to a probable cause and recommended next step.

Prioritizing High-Impact Insights
Turning performance signals into prioritized actions

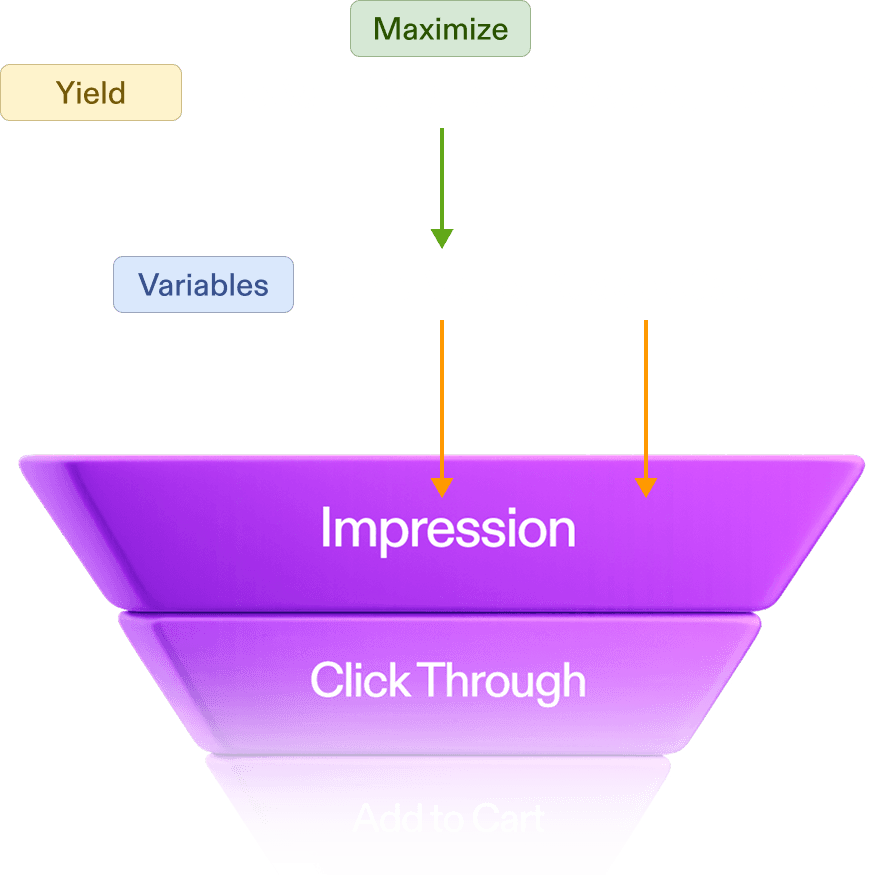
We prioritized insights based on two factors: business impact and actionability.

By connecting outcomes like ROAS to controllable levers such as bid and budget, the system could identify which intervention was most likely to improve performance—and surface that action first.
RoAS Efficient Frontier
Explaining when efficiency limits growth

A high ROAS can look like strong performance, but it may also signal underbidding and untapped sales volume.

We explored the ROAS Efficient Frontier to show when increasing bids could unlock more demand while maintaining efficient returns. It appeared only when the system detected low bids paired with unusually high ROAS.

Solution

From reporting to guided optimization
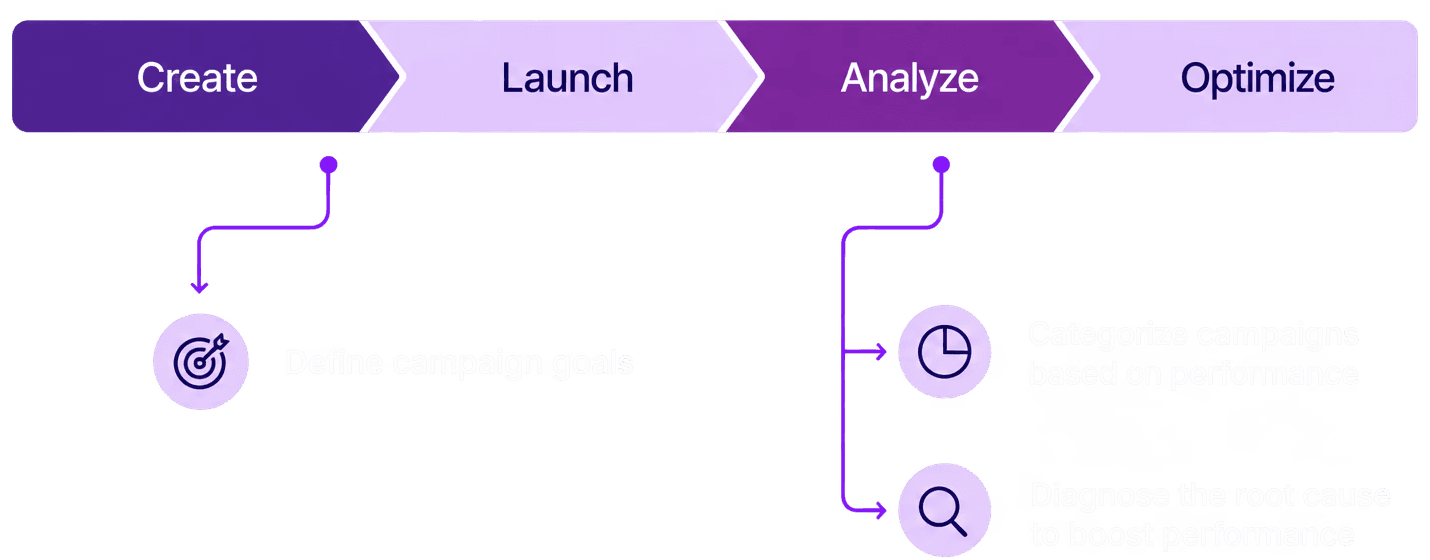
We redesigned the campaign experience around a simple progression: define the goal, understand performance, diagnose issues, and take action.

Instead of asking sellers to interpret aggregated metrics on their own, the new experience connected campaign intent to performance and surfaced clearer recommendations for what to do next.

Instead of asking sellers to interpret aggregated metrics on their own, the new experience connected campaign intent to performance and surfaced clearer recommendations for what to do next.

01
Goal-Based Campaign Creation & Analytics
Show the metrics that matter for the objective

The existing dashboard surfaced campaign details and performance metrics, but it did not give sellers a clear way to understand campaign goals or assess campaign health. We introduced goal selection at the beginning of campaign creation so sellers could define whether they wanted to launch a new product, promote best sellers, clear inventory faster, or run a standard campaign.

Making intent explicit gave the system a foundation for tailoring analytics and recommendations later in the journey.

The existing dashboard surfaced campaign details and performance metrics, but it did not give sellers a clear way to understand campaign goals or assess campaign health. We introduced goal selection at the beginning of campaign creation so sellers could define whether they wanted to launch a new product, promote best sellers, clear inventory faster, or run a standard campaign.

Making intent explicit gave the system a foundation for tailoring analytics and recommendations later in the journey.

02
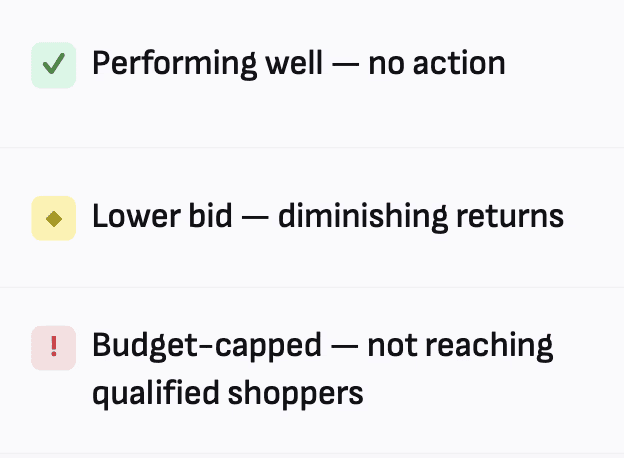
Campaign Health at a Glance: 3-Point System
faster way to understand which campaigns required attention

Not every problem deserves equal attention! We developed a root-cause prioritization model that connected outcome metrics such as ROAS to variables such as bid value and budget cap, then applied a similar approach to rank products within campaigns.

Not every problem deserves equal attention! We developed a root-cause prioritization model that connected outcome metrics such as ROAS to variables such as bid value and budget cap, then applied a similar approach to rank products within campaigns.

Color systems that align with Wayfair’s internal visual system
03
Surface the reason behind the status
Move from “something is wrong” to “here’s why”

A status signal alone was not enough. We added an Insights layer that surfaced likely problems at the product level, including issues such as insufficient budget, low bid value, or low attributed sales.

A status signal alone was not enough. We added an Insights layer that surfaced likely problems at the product level, including issues such as insufficient budget, low bid value, or low attributed sales.

04
Recommendation logic
Turn diagnosis into a clear next action

Once a likely root cause was identified, the system translated that diagnosis into a specific recommendation. The logic focused on controllable campaign variables such as bid value and budget cap, connecting them to outcomes like impressions, revenue, and ROAS.

Once a likely root cause was identified, the system translated that diagnosis into a specific recommendation. The logic focused on controllable campaign variables such as bid value and budget cap, connecting them to outcomes like impressions, revenue, and ROAS.

05
Explain Counterintuitive Recommendations
High ROAS does not always mean optimal performance

One recommendation required additional explanation: increase the bid when ROAS is unusually high.

A highly efficient campaign can still be underinvested. If bids are too conservative, sellers may preserve strong ROAS while limiting impressions and sales volume.

We introduced a ROAS Efficient Frontier visual specifically for this scenario, helping sellers understand the tradeoff between maximizing efficiency and capturing additional demand.

One recommendation required additional explanation: increase the bid when ROAS is unusually high.

A highly efficient campaign can still be underinvested. If bids are too conservative, sellers may preserve strong ROAS while limiting impressions and sales volume.

We introduced a ROAS Efficient Frontier visual specifically for this scenario, helping sellers understand the tradeoff between maximizing efficiency and capturing additional demand.

06
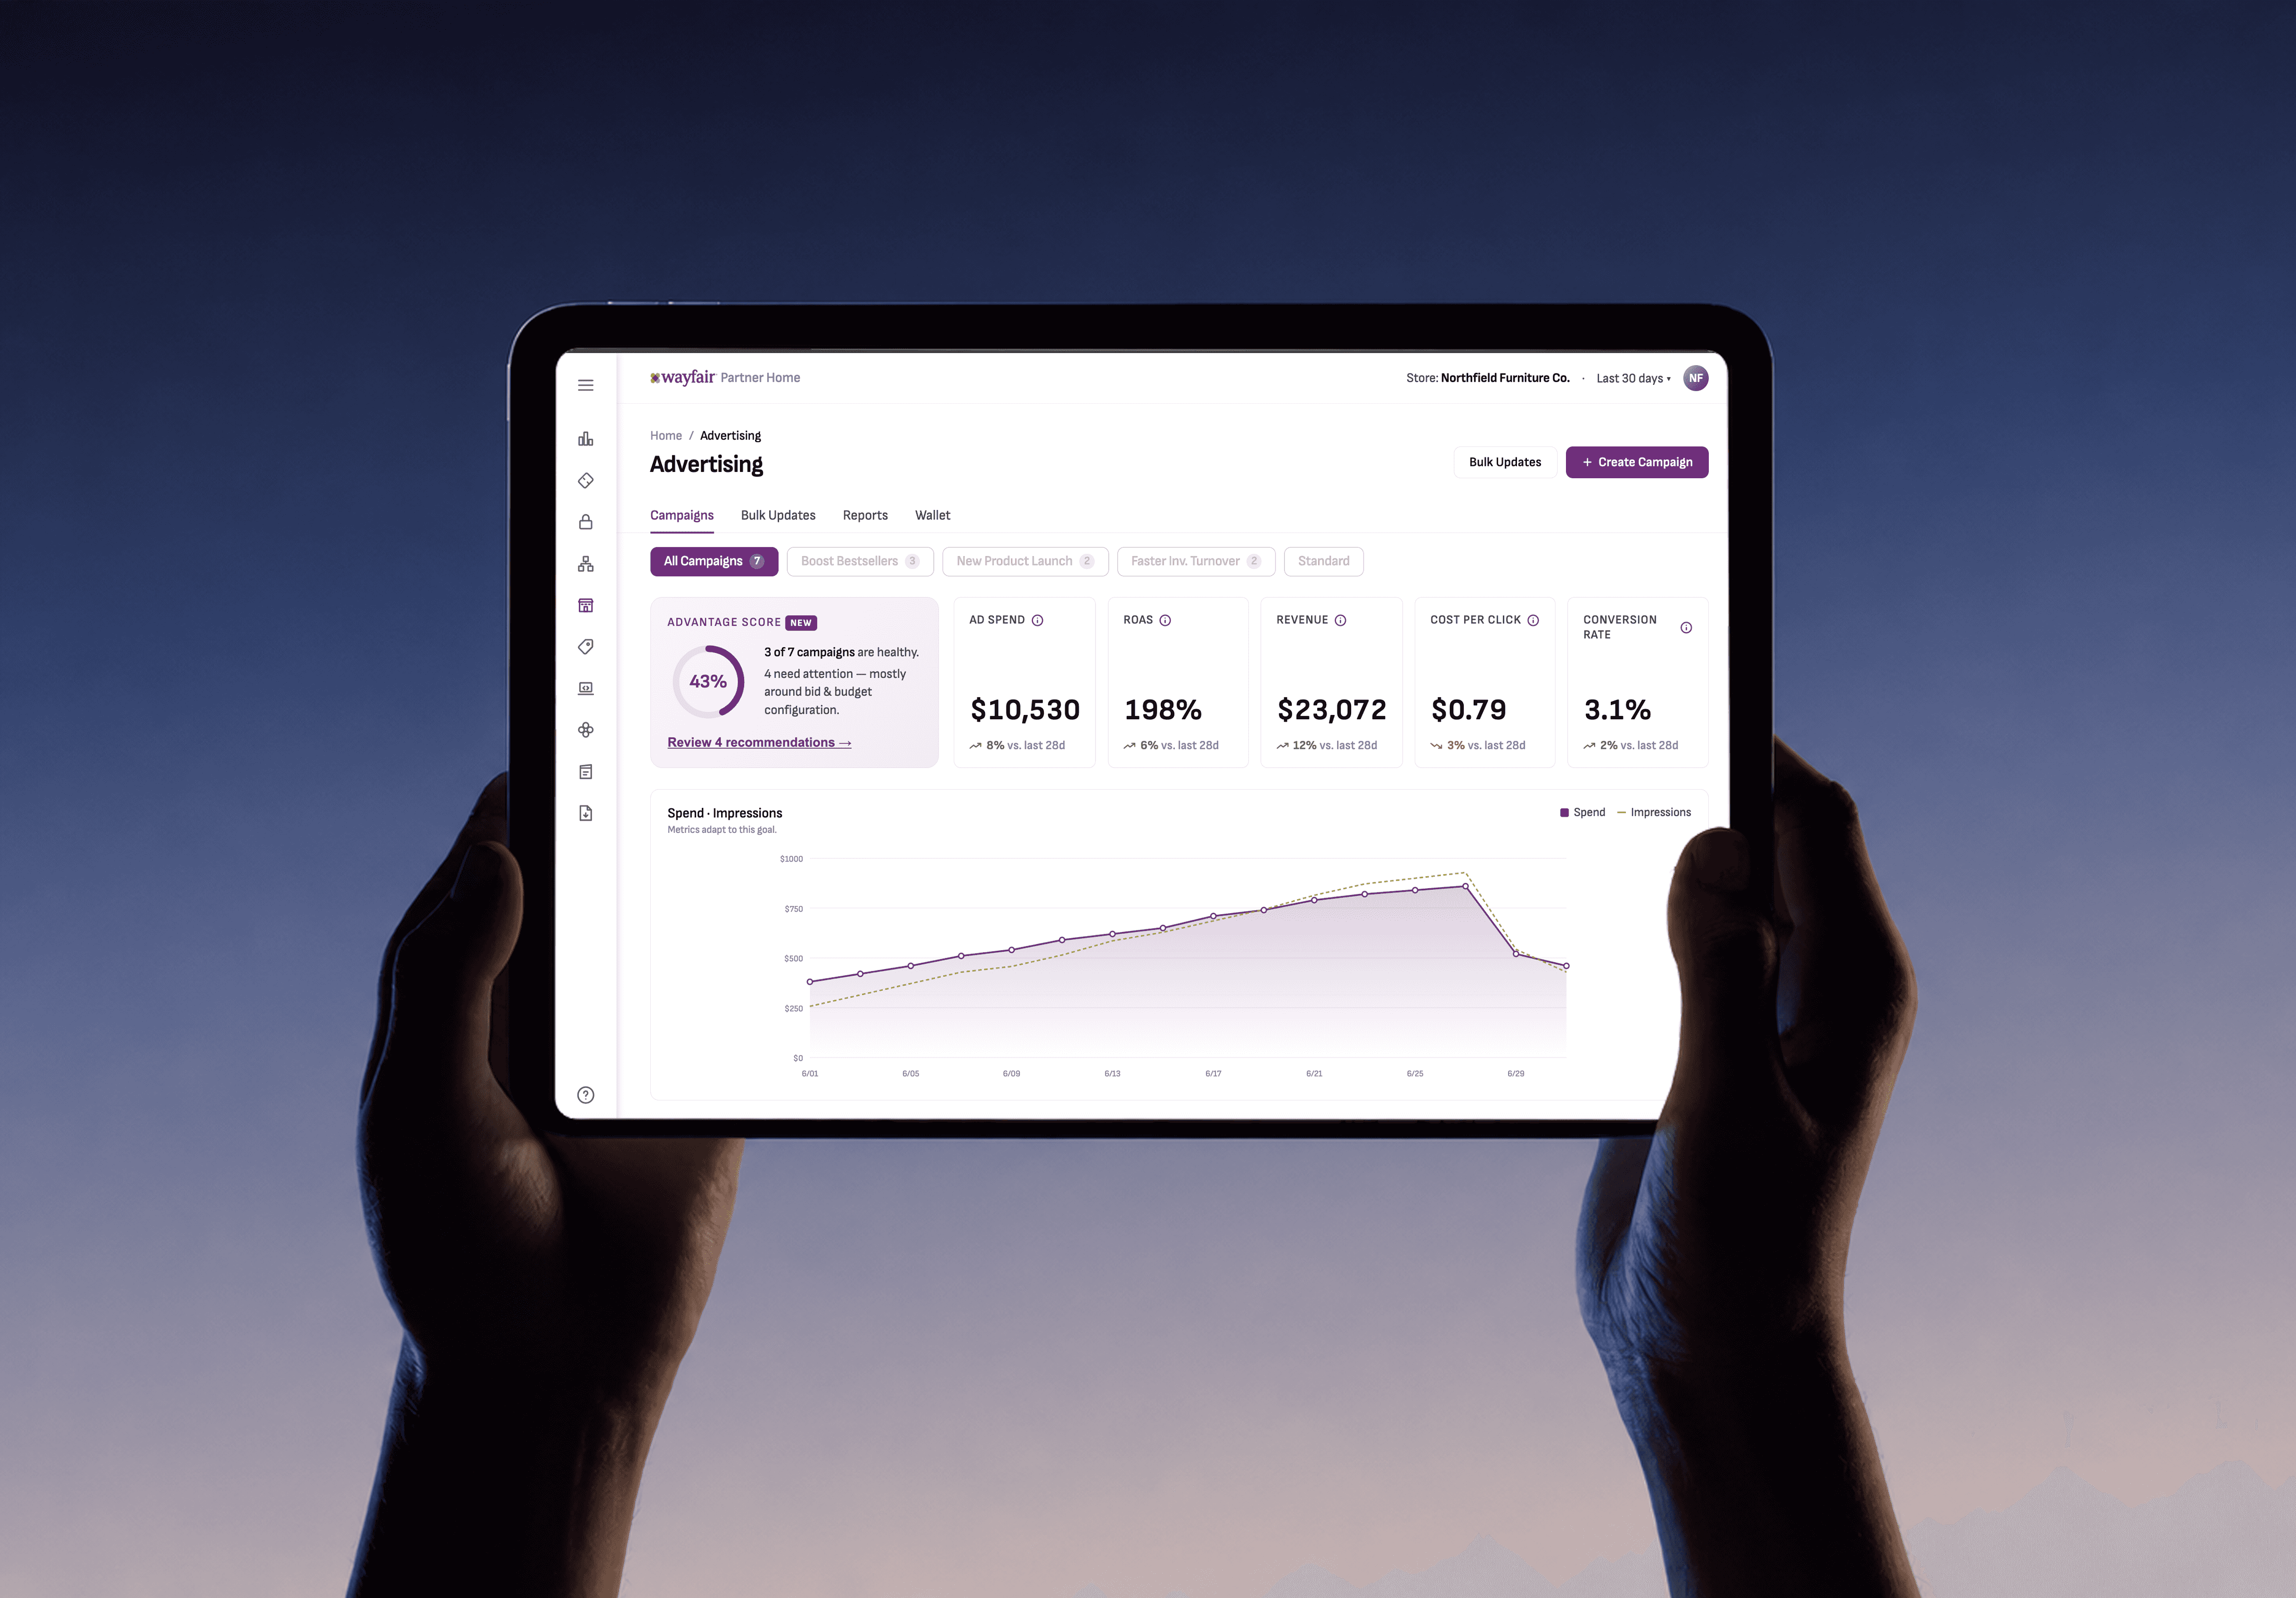
AdVantage Score
AdVantage Score
Give sellers a portfolio-level view of optimization

Individual recommendations were useful, but sellers also needed a way to understand overall campaign health. AdVantage Score is a percentage representing how many products across campaigns still required action for further optimization.

Individual recommendations were useful, but sellers also needed a way to understand overall campaign health. AdVantage Score is a percentage representing how many products across campaigns still required action for further optimization.

07
Guide new-product launches
Using goals and positive reinforcement to support stronger launch readiness

For new-product campaigns, we explored a more proactive form of guidance.

Rather than waiting for performance problems to appear, the experience used milestones around actions such as uploading product images, improving product descriptions, and building reviews. The intention was to create a guide rather than a checklist, using goals and positive reinforcement to support stronger launch readiness.

For new-product campaigns, we explored a more proactive form of guidance.

Rather than waiting for performance problems to appear, the experience used milestones around actions such as uploading product images, improving product descriptions, and building reviews. The intention was to create a guide rather than a checklist, using goals and positive reinforcement to support stronger launch readiness.

Impact

Together, these changes transformed the experience from a dashboard that primarily reported performance into a system that could help sellers:

01
Define intent
02
Detect issues
03
Understand why
04
Prioritize opportunities
05
Take action
The redesign did not add more data. It made the existing data easier to interpret, prioritize, and act on.
4 Potential Benefits for Wayfair
Campaign Performance

Improved campaign metrics through automated promotion insights

Increased Platform Spend

Sellers spend more by acting on data-driven insights

Operational Efficiency

Reduces workload for Ad campaign managers

Revenue Opportunity

Possible monetization of the diagnosis feature set

Campaign Performance

Improved campaign metrics through automated promotion insights

Increased Platform Spend

Sellers spend more by acting on data-driven insights

Operational Efficiency

Reduces workload for Ad campaign managers

Revenue Opportunity
Revenue Opportunity

Possible monetization of the diagnosis feature set

Sequence of Implementation
1
Launch with select sellers managed by AMs supported with these tools
2
Extend it to further managed sellers and introduce it to non-managed sellers identified by AMs
3
Platform wide roll-out

Let’s talk about

the next big thing!

Connect with me 👋🏻

Hello! I'd like to personally thank you for stopping by my little corner of the internet, I hope you enjoyed your stay.

Let’s talk about

the next big thing!

Connect with me 👋🏻

Hello! I'd like to personally thank you for stopping by my little corner of the internet, I hope you enjoyed your stay.

Let’s talk about

the next big thing!

Connect with me 👋🏻

Hello! I'd like to personally thank you for stopping by my little corner of the internet, I hope you enjoyed your stay.